Definition
Learning Analytics, as defined for UBC’s Learning Analytics Project, “involves the measurement, collection, analysis, and reporting of data about learners and their contexts with the goal of understanding and optimizing learning and the environments in which learning occurs.”
For more on UBC’s Learning Analytics Project, visit https://lthub.ubc.ca/projects/learning-analytics/
Note that information presented on this page may not represent current practice at UBC, and is presented as an informational overview of Learning Analytics research and practice in a general sense.
Check how out the Faculty of Arts at UBC have been pioneering Learning Analytics practices at UBC.
Instructional Interventions
Information about how learners engage with learning materials, with each other, their instructors, as well as how they perceive their learning experiences and to what level they meet learning outcomes are all valuable points of interest to improve teaching and learning. By looking at this information, instructors can make judgements about how to best support their students in their learning process, from reminding them of assignment due dates and crafting online forum prompts, to informing future designs of new and existing courses.
Prediction
Predictive analytics provide useful information for the future success of learners, based on previous performance, and engagement with learning materials and other points of interest. Some forms of analytics currently being researched use Artificial Intelligence (AI) and Machine Learning (ML) to use algorithms to predict learner success given a number of data points and factors. This is turn can be used to automate interventions to support student success in the form of early alerts to instructors, assignment reminders and other strategies.
Personalization
Learning analytics can also inform personalized learning, giving students a customized learning experience which can provide useful insights into their own understanding of new information, and provide scaffolding activities to support their successful completion of a course.
Information Visualization
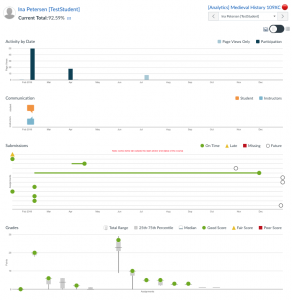
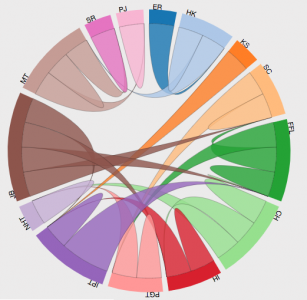
When deciding on which instructional intervention would be most appropriate for each individual student, instructors should be able to easily understand the data they are looking at. Instead of large spreadsheets and vast arrays of text data, Learning Analytics can provide easily understandable visualizations of how learners are engaging in a course, with their assessments or specific tools. These visualizations can then be used to make sound judgements
Data used for learning analytics purposes can be pulled from a number of sources. As many activities we participate in online require the use of a user account, this provides data on an individual’s activities within a number of technology platforms that support teaching and learning.
Generally, data on individuals is collected and anonymized to provide insights into engagement and participation for an entire course.
UBC is actively working on policies that govern the appropriate use of data (student, professional and academic staff), so any use of data for analytics purposes must fall within the scope of these policies, which ensure data security, privacy to ensure the appropriate use of this data.
Canvas Analytics
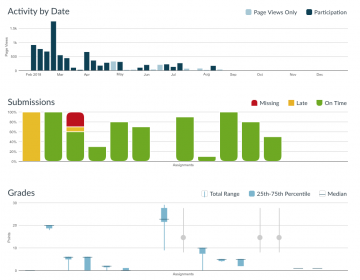
Out of the box, canvas provides meaningful data on student interactions, participation and engagement with materials. While there are some limitations to this information, instructors can use this information to make meaningful decisions in their teaching practice.
Threadz
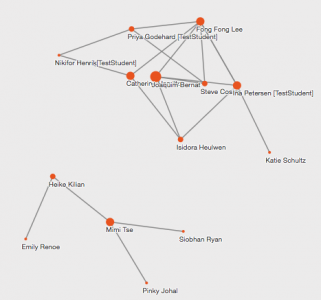
A learning analytics pilot project being conducted by CTLT uses a tool called Threadz, to provide Social Network Analysis (SNA) tools to examine how learning communities online evolve over time, including how individuals participate and the social networks they become active in.


